Fig. 4.
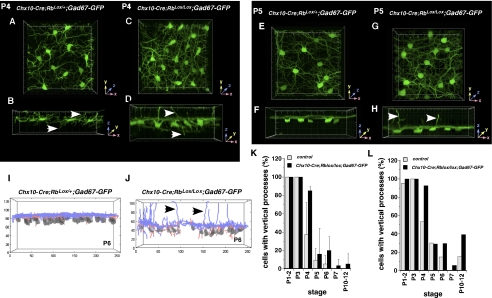
Reorganization of horizontal cell processes during development. (A–D) 3D multiphoton confocal images of representative fields of control (A and B) and Rb-deficient (C and D) retinas showing GFP-labeled HCs at P4. Top view is shown in A and C, and the corresponding side view is shown in B and D. Arrows indicate apical and basal processes. Individual grid marks correspond to 1-μm increments. (E–H) 3D multiphoton confocal images of representative fields of control (E and F) and Rb-deficient (G and H) retinas showing GFP-labeled HCs at P5. The top view is shown in E and G, and the corresponding side view is shown in F and H. Arrows indicate apical processes still present in the absence of Rb. Individual grid marks correspond to 1-μm increments. (I and J) 3D reconstructions and automated tracings of a representative field of GAD67-GFP expression in HCs in control (I) and Rb-deficient (J) retinas. Arrows indicate apical processes still present in the absence of Rb. (K and L) Histograms showing proportion of cells with vertical processes at each developmental stage. Each bar represents the mean (± SD) of multiple independent retinas and multiple fields of view within each retina. Data plotted in K correspond to the semimanual tracing results, and those in L correspond to automated tracing.

