Fig. 5.
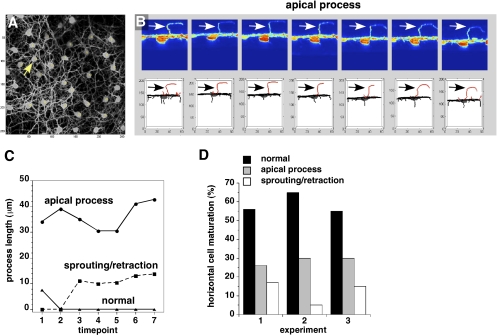
Multiphoton live imaging of HCs in Chx10-Cre;RbLox/Lox;Gad67-GFP retinas. (A) Top view of a representative field with 20 HCs. Arrow indicates cells shown in B. (B) Side view (Upper) of a single cell with a persistent apical process (arrow) and the corresponding 3D tracing of that cell (Lower) at seven representative sequential 1-h time points. Apical processes are shown in red. Arrows indicate an ectopic HC process. (C) The length of the processes was plotted to represent a persistent apical process (Top), a process that showed dynamic changes during the time course (sprouting/retraction) (Center), and a process that underwent normal maturation (Bottom). (D) Histogram of the proportion of cells in three experiments with persistent apical processes, dynamic changes in their processes (retraction/sprouting), and normal processes.

