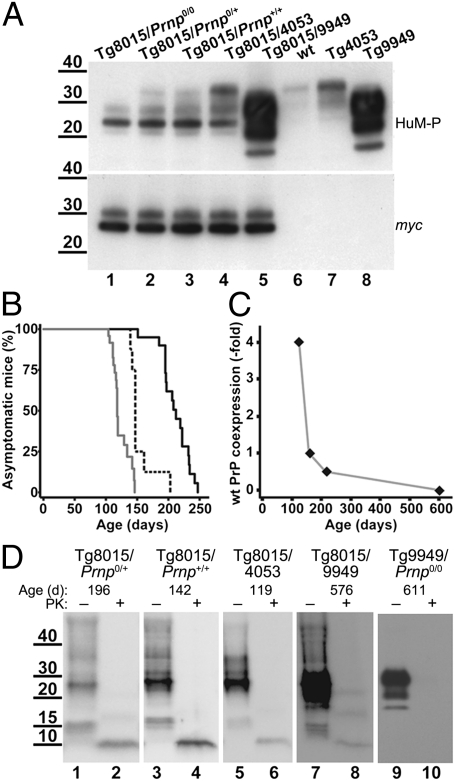
Fig. 3.
Characterization of Tg8015 mice coexpressing wt PrP. (A) Analysis of total PrP levels by Western blot of brain homogenates obtained from Tg mice expressing only PrP(ΔGPI) (lane 1) or coexpressing different levels of wt PrPC (lanes 2–4) or N-terminally truncated PrP (lane 5). PrP expression levels of Tg mouse lines that were used to create the coexpressors are shown as controls (lanes 6–8). (Upper) Probed using the anti-PrP Fab HuM-P, shows the total PrP content; (Lower) detected using anti-myc tag antibody, shows only PrP(ΔGPI) expression. Neither wt PrP nor PrP(ΔGPI) expression level was affected by coexpression. (B) Kaplan–Meier survival curves of three different mouse lines coexpressing PrP(ΔGPI) at 1.7× and PrPC at various levels: Tg8015/Prnp0/+ (0.5× wt PrP; solid black line), Tg8015/Prnp+/+ (1× wt PrP; dashed black line), and Tg8015/4053 (4× wt PrP; solid gray line). (C) Plot of the relationship between wt PrPC coexpression level and age of onset of spontaneous disease. (D) Western blots of insoluble PrP isolated from brain homogenates of ill Tg8015/Prnp0/+ (lanes 1 and 2), Tg8015/Prnp+/+ (lanes 3 and 4), Tg8015/4053 (lanes 5 and 6), Tg8015/9949 (lanes 7 and 8), and Tg9949/Prnp0/0 (lanes 9 and 10) mice before (–) and after (+) PK digestion. The age of mice when clinical symptoms manifested is indicated above each panel. A ∼10-kDa, PK-resistant PrP fragment is apparent in the brains of all mice expressing PrP(ΔGPI). PrP was detected with the Fab HuM-P. In A and D, molecular masses are shown in kilodaltons.

