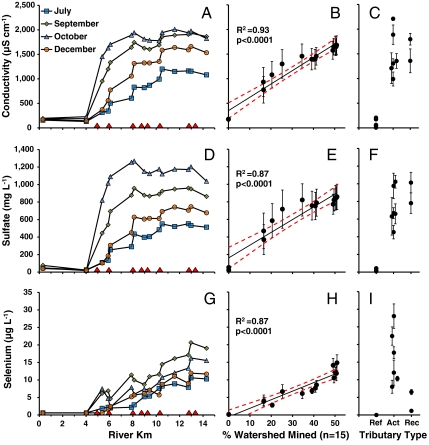
Fig. 2.
Longitudinal patterns of conductivity and stream solutes and their correlation to the areal extent of upstream surface mining. Increases in conductivity (A), sulfate (D), and selenium (G) on the mainstem of the Upper Mud River are shown for the four most complete survey months in the study. The locations of MTM-impacted tributary inflows are indicated by red triangles on the x axis. The proportion of the contributing watershed in surface mines explains a significant fraction of the variation in stream water conductivity (B) sulfate (E), and selenium (H) concentrations in the mainstem of the Mud River (error bars denote standard error of the mean for the four monthly measurements, red dashed line is the 95% confidence interval for the regression line). The variation in conductivity and solute concentrations in the mainstem are directly compared to data over the same four dates for the eight state reference streams (Ref) within the Upper Guyandotte watershed (data from WVDEP) (10) and tributaries within the Mud River that drained either watersheds with active MTM (Act) or watersheds with historic surface mines reclaimed nearly 20 years ago (Rec). Our detection limit for selenium was 1.1 μg L-1.

