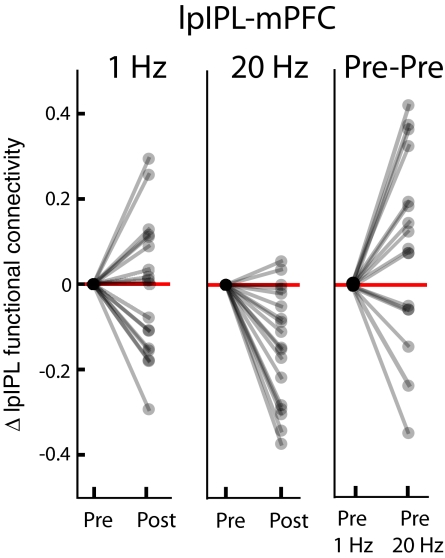
Fig. 5.
Changes in functional connectivity with and without intervening rTMS. Plots indicate relative changes (normalized to zero values for pre-rTMS connectivity) for each participant between the stimulation site (lpIPL) and mPFC. The majority of participants showed a decrease in functional connectivity between lpIPL and mPFC following 20-Hz (Center), but no change and significant intersubject variability occurred following 1 Hz (Left) and across their pre–1-Hz and pre–20-Hz rTMS sessions (Right).

