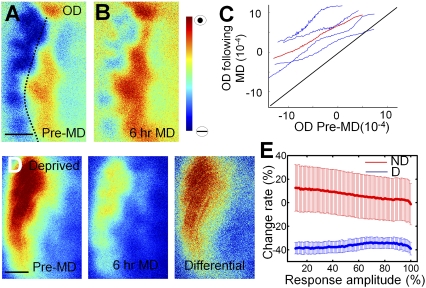
Fig. 3.
A global shift of OD is evoked by brief MD. (A and B) OD maps of the same visual cortex before (A) and after 6 h of MD (B). Dotted line shows the border of area 17 and 18. (C) Pixel-to-pixel correlation of ODI before and after MD. Blue, four individual ferrets; red, average of four animals. The entire set of pixels was divided into 100 bins according to their ODI percentile before MD; the same group of pixels in each bin was then averaged after MD. Notice the ODI shift toward the nondeprived eye in monocular and binocular regions. (D) Greater loss of absolute responsiveness in deprived eye-dominated regions. The differential map (comparing pre-MD control and after MD) resembles the control map pattern. (E) Graph shows proportional change in responsiveness for the deprived and nondeprived eyes. The x axis shows the degree of pre-MD response from either eye across the pixels of the map; pixels can vary from near 0% to near 100% response amplitude from each eye. The y axis shows the shift in relative response after MD; note that both the deprived (“D”) and nondeprived (“ND”) lines are nearly horizontal, indicating that the percent response change is independent of the initial responsiveness of pixels to one or the other eye. Thus, although the proportional change is uniform, deprived eye-dominated regions show greater absolute loss of responses. (Scale bars: 1 mm.)

