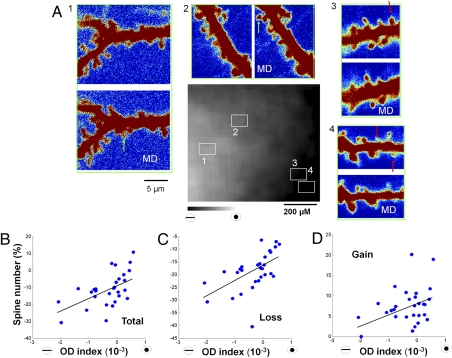
Fig. 6.
Dendritic spine remodeling correlates with functional changes in defined OD regions within V1. (A) Spine turnover in four regions (marked 1–4 with squares in OD map, Center) with different OD preferences after 6 h of MD. Green arrows, new spines; red arrows, lost spines. (B-D) Rates of change of total number (B), loss (C), and gain (D) of spines as a function of ODI at each of 29 sites. Each site includes the analysis of all spines in an 80 × 60-μm region, and corresponds to a region of 6 × 4 pixels in the intrinsic signal imaging map (SI Materials and Methods). ODI was less than −0.001 at four sites with 436 spines; greater than −0.001 and less than 0 at 15 sites with 1,155 spines, and between 0 and 0.001 at 10 sites with 1,015 spines.

