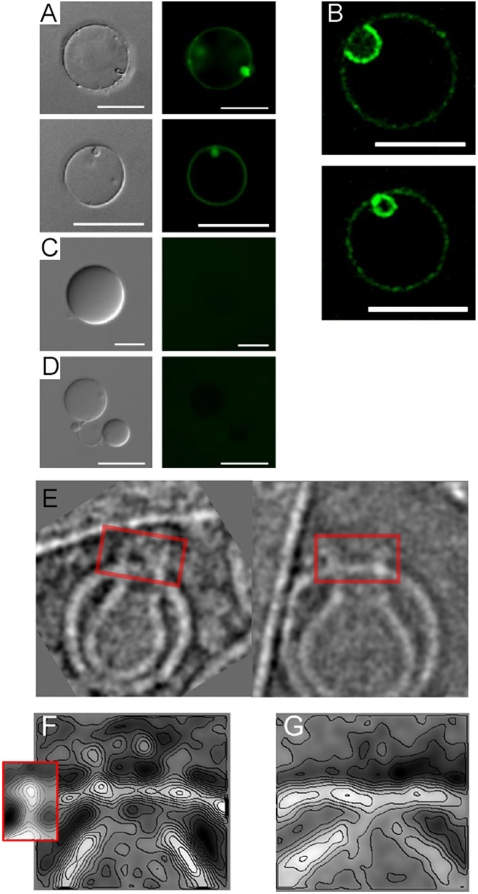
Fig. 2.
Detection of membrane-bound PFN by anti-PFN δG9-FITC labeled antibodies and cryo-EM. (A) Fluorescence microscopy of GUVs in the presence of 12 nM (Top) or 24 nM (Bottom) of PFN stained with anti-PFN δG9-FITC labeled antibodies. (B) Confocal microscopy that shows a cross section of two GUVs with enriched signal in the invagination (Top) and in the ILV (Bottom). The experiment was performed as in A, the concentration of PFN was 24 nM. (C) GUVs in the absence of PFN and in the presence of anti-PFN δG9-FITC labeled antibodies. (D) GUVs in the presence of 24 nM PFN and isotype antibodies control (IgG2b isotype; antiglycophorin-FITC labeled antibodies). Scale bar is 20 μm in A, B, and D, but 10 μm in C. The concentration of antibodies was approximately 30 μg/mL. Differential interference contrast images are shown for comparison (Left). (E) Images of LUV invaginations with PFN oligomers (boxed). (F) Representative class average contour plot derived from alignment and classification of images of the junctions between primary outer membranes and secondary internal compartments/invaginations in the presence of PFN. Inset shows the subunit structure of PFN in its oligomeric prepore state bound to the membrane surface (20). (G) The equivalent image to F derived in the absence of PFN.

