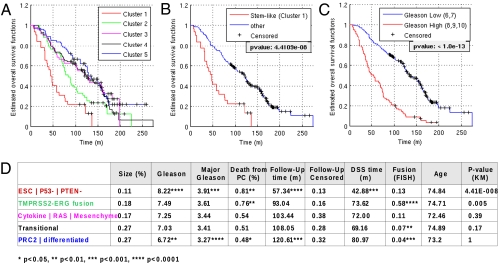
Fig. 3.
Clinical analysis of clusters shows graded outcomes with the stem-like group having the poorest outcome. Clinical outcome data available for the Swedish watchful-waiting cohort (Sboner et al.) (27) (GSE16560) were analyzed on the distinct subgroups found by signature profiling. (A–C) Kaplan–Meier estimates for survival functions for the different subgroups, including side-by-side comparison of survival analysis based on signature profiling (A and B) and Gleason score (C). Note that the stem-like group in A and B contains 11% of samples, whereas the group with high Gleason scores in C contains 29% of samples. (D) Clinical variables for the subgroups show a highly significant prognostic value for the stem-like subtype. Follow-up (FU) time is listed together with censoring for overall survival, lethality indicates cases with disease-specific death as determined in the original study, and DSS time refers to disease-specific survival time. Fusion refers to actual TMPRR2–ERG fusion status (FISH). Age distribution was insignificant for all groups. The last column shows the P values for differences in the Kaplan–Meier plots associated with the tested group versus all other groups having higher mean survival times. Significance of assignments is indicated by asterisks.

