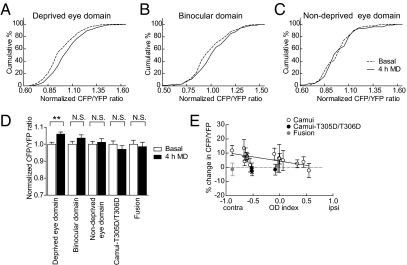
Fig. 2.
Changes in synaptic CaMKII activity in spines within different eye domains after 4 h MD. (A–C) CaMKII activity of individual synapses in (A) deprived eye domains (ODI < −0.1, n = 201 spines from seven imaging sites), (B) binocular domains (−0.1 ≤ ODI ≤ 0.1, n = 99 spines from five imaging sites), and (C) nondeprived domains (ODI > 0.1, n = 70 spines from three imaging sites) before (basal) and after 4 h MD. CFP/YFP ratios of individual spines normalized to the average basal CFP/YFP ratio of all spines within the respective imaged cortical site are plotted. (D) Bars show mean values of data pooled from each site imaged in individual animals, including data from negative control constructs: Camui-T305D/T306D (n = 98 spines from three imaging sites) and C-Y fusion protein (n = 33 spines from two imaging sites). **P < 0.05 (KS test); N.S., nonsignificant. (E) Mean percent change in FRET within spines in each imaging site shown in A–C, including negative control data sites pooled in D, plotted versus their respective ODI value (R = −0.65). Error bars represent SEM within each imaging site.

