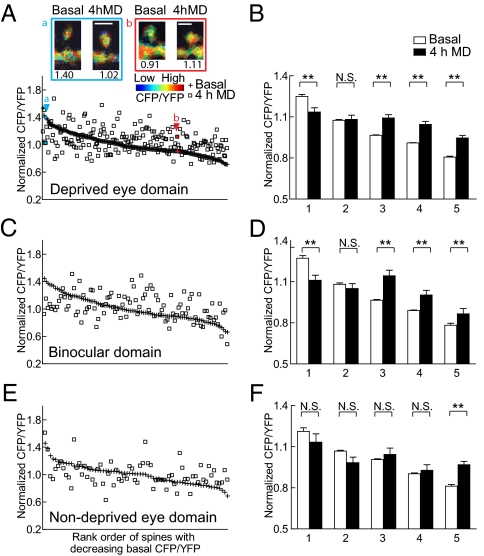
Fig. 3.
CaMKII activation increases in deprived domain spines with low to moderate basal CaMKII activity and decreases in spines with high basal CaMKII activity. (A) Bottom: Normalized basal CFP/YFP ratios from individual spines in the deprived eye domain are ranked and plotted in decreasing order along with their respective CFP/YFP ratio after 4 h MD. Top: Intensity modulated display images of a spine with high basal and lower CaMKII activity after 4 h MD (A) as well as a spine with low basal and higher CaMKII activity level after 4 h MD (B). Spines a and b are indicated by their respective arrowheads in the plot. CFP/YFP values of the spines are shown below their images. (Scale bar: 2 μm.) (B) Data from A were binned in 20% increments and the mean was plotted. Numbers 1–5 on the x axis denote the first to fifth bins (**P < 0.05, paired two-tailed t test). (A and B) n = 201 spines from seven imaging sites. (C–F) Normalized spine CFP/YFP ratios in the binocular domain (C and D) and open eye domain (E and F) plotted in the same manner as A and B. (C and D) n = 99 spines from five imaging sites; (E and F) n = 70 spines from three imaging sites. Error bars represent SEM.

