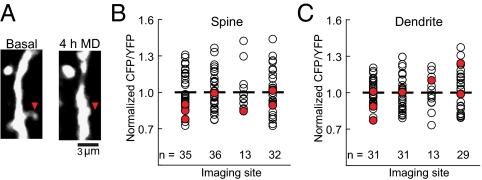
Fig. 4.
Spines that are lost following 4 h MD have low basal CaMKII activity. (A) Arrowhead shows a dendritic spine that was lost after 4 h MD. (B) Distribution of basal CaMKII activity in eliminated and spared spines. Circles represent basal CaMKII activity in individual spines grouped according to imaged cortical site. Only sites which contained eliminated spines are shown. Horizontal bars indicate the population mean CFP/YFP ratio of each imaged cortical site. Red circles indicate spines that were eliminated after 4 h MD. White circles indicate spines that persisted after 4 h MD (n indicates spine number, including spines that disappeared, in each imaged region; seven out of a total of 116 spines were eliminated). Eliminated spines have significantly lower basal CFP/YFP ratios (P < 0.05, two-tailed t test). (C) Basal CaMKII activity levels in dendritic regions adjacent to spines that were eliminated were not significantly different from the population mean of their imaging site, shown as in B (P > 0.05, two-tailed t test).

