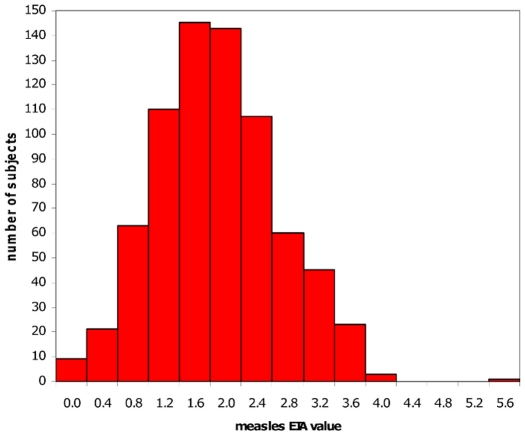
Figure 2. Distribution of measles vaccine–induced antibody levels.
This graph represents the distribution of antibody levels determined by an EIA assay on healthy grade-school children immunized with a single dose of MMR-II vaccine. The inter-individual variation in antibody levels among this healthy cohort illustrates the importance of determining the mechanisms for heterogeneity in vaccine response.

