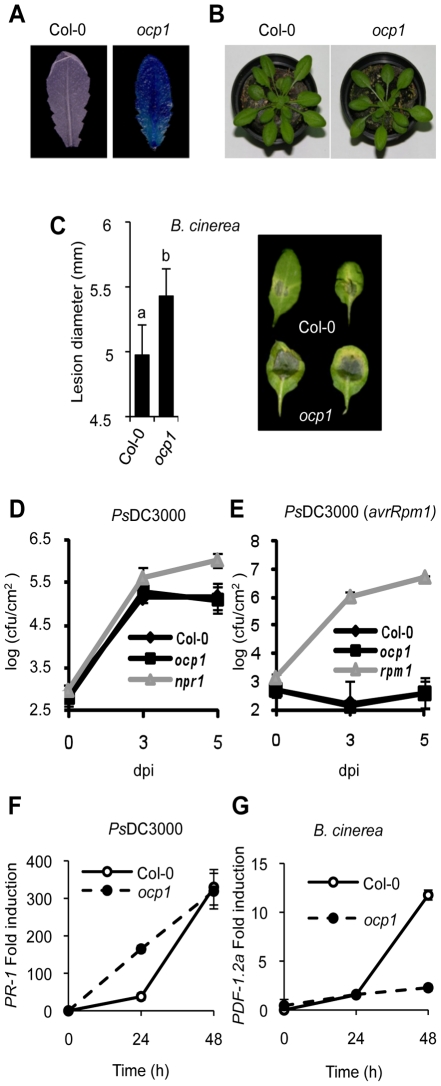
Figure 1. Characterization of ocp1 plants.
(A) Comparative histochemical analysis of GUS activity in rosette leaves from a parental wild-type plant carrying the PEp5C:GUS transgene (left), and ocp1 mutant plant (right). (B) Macroscopic comparison of 3-week-old wild-type (left) and ocp1 plants (right). (C) Resistance response of wild-type and ocp1 plants to virulent B. cinerea. Lesion size was measured 5 days after inoculation (dpi). Data points represent average lesion size ± SE (n≥30 lesions). Representative leaves from wild-type and ocp1 plants 4 dpi. (D–E) Growth rates of virulent PsDC3000 (D) and avirulent PsDC3000 (AvrRpm1) (E) in Col-0, ocp1 and npr1 or rpm1 plants. (F–G) RT-qPCR expression analysis of PR-1 (F) and PDF1.2a (G) in wild-type and ocp1 plants at different times following inoculation with PsDC3000 (F) and B. cinerea (G). Data represent the mean ± SD; n = 3 biological replicates.

