
Figure 6. Comparative immune responses of Pol IV and Pol V defective mutants to inoculation with Pseudomonas syringae DC3000.
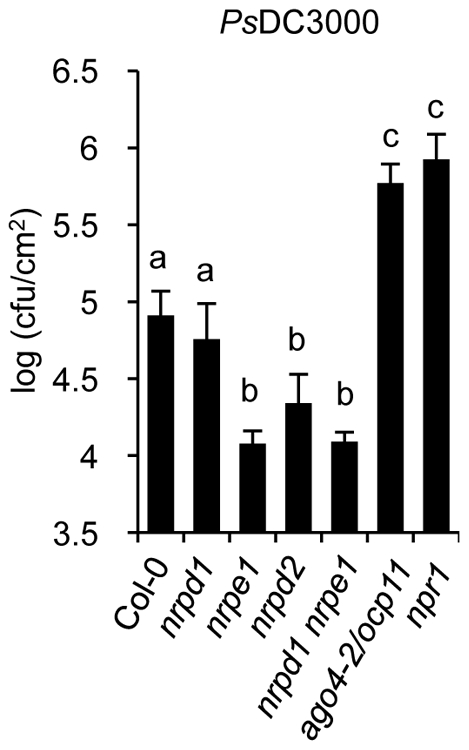
Growth rates of PsDC3000 in Col-0, nrpd1, nrpe1, nrpd2, and nrpd1 nrpe1 plants. The PsDC3000 disease susceptible mutants ago4-2/ocp11 and npr1 were included for comparison. Data represent the mean ± SD; n = 3 biological replicates.