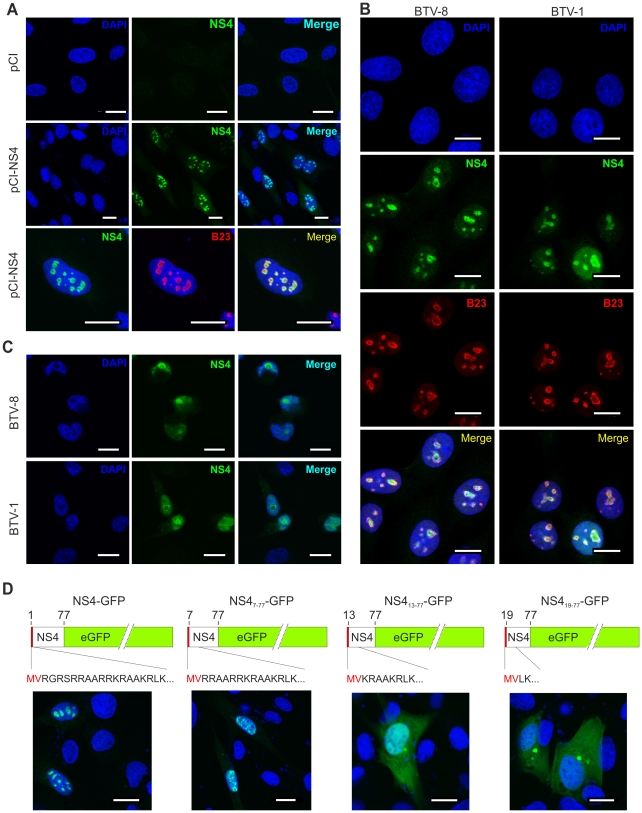
Figure 2. NS4 localises in the nucleoli of transfected and infected cells.
(A) Confocal microscopy of CPT-Tert cells transfected with pCI-NS4 or empty pCI as a control. At 24 h post-transfection, cells were fixed and analyzed by immunofluorescence using antibodies against NS4 and as indicated the nucleolar marker B23 with the appropriate conjugated secondary antibodies as described in the Materials and Methods. Scale bars correspond to 18 µm. (B) Confocal microscopy of BSR cells infected by BTV-1 and BTV-8 at a MOI of 0.01. At 24 h post-infection, cells were fixed and analyzed by immunofluorescence as indicated in A. Scale bars correspond to 14 µm. (C) Confocal microscopy of C6/36 cells infected by BTV-1 and BTV-8 at a MOI of 0.05. At 48 h post-infection, cells were fixed and analyzed by immunofluorescence as for expression of NS4 as indicated in panel A. Scale bars correspond to 11 µm. (D) Confocal microscopy of CPT-Tert cells transfected with pNS4-GFP or the truncated mutants indicated above each panel. The red box corresponds to the first two amino terminal amino acid residues of NS4 that were maintained in all mutants. At 24 h post-transfection, cells were fixed and analyzed by immunofluorescence. Scale bars correspond to 18 µm.

