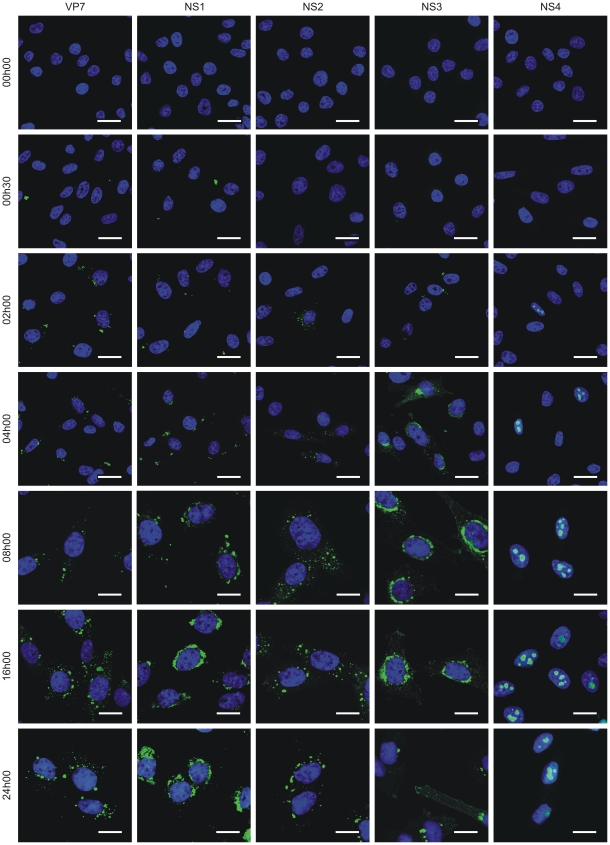
Figure 3. NS4 expression profile.
Confocal microscopy of BFAE cells infected with BTV-1 at a MOI of 1.5. Cells were fixed before infection (0 h) and at 0 h30, 2 h, 4 h, 8 h, 16 h and 24 h post-infection and processed for immunofluorescence using antibodies against VP7, NS1, NS2, NS3 and NS4 with an Alexa Fluor 488 secondary antibody as described in the Materials and Methods. Scale bars correspond to 21.16 µm for 0 h to 4 h post-infection panels, and 13.6 µm for 8 h to 24 h post-infection panels.

