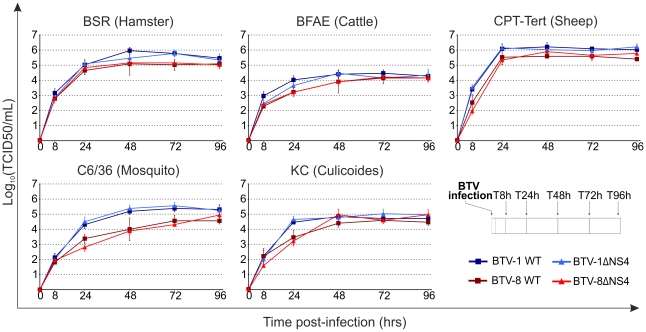
Figure 5. In vitro growth properties of rescued WT and ΔNS4 viruses.
Growth curves of BTV-8 (dark red, square), BTV8-ΔNS4 (red, triangle), BTV-1 (blue, square) and BTV1-ΔNS4 (light blue, triangle) in cell lines derived from different species. BSR (hamster), BFAE (cattle), CPT-Tert (sheep), C6/36 (mosquito) and KC (Culicoides) cells were infected at a MOI of 0.05 and supernatants collected at 8, 24, 48, 72 and 96 h after infection. Supernatants were then titrated on BSR cells by limiting dilution analysis and the virus titers expressed as log10 (TCID50/ml). In parallel, each virus preparation was also re-titrated by limiting dilution analysis to control that equal amounts of input virus was used in each experiment. Experiments were performed independently twice, each time in duplicate, using two different virus stocks.

