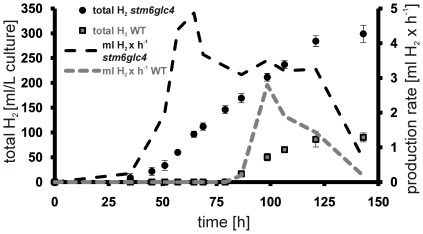
Figure 2. Total volume of H2 produced by stm6glc4 (black circles) and WT (grey squares) during the course of the experiment.
The total volume of H2 produced during the experiment expressed as ml/L culture is shown on the left y-axis with the duration of the experiment indicated on the x-axis. Production rates given as ml per hour are indicated on the right y-axis and presented as dotted lines.

