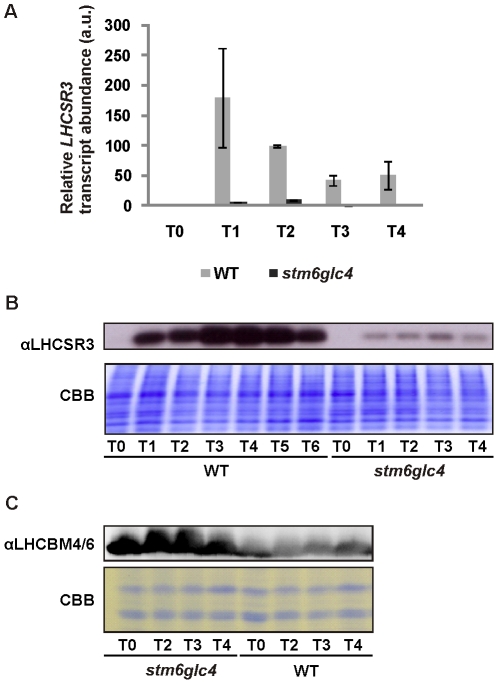
Figure 5. Expression of LHCSR3 in WT and stm6glc4 under H2 production conditions.
A: Real-time RT-Q-PCR analysis of LHCSR3 mRNA expression in the WT (grey bars) and mutant stm6glc4 (black bars) before (T0) and after sulphur deprivation (T1–T4). The indicated time points correspond to those used for microarray sample collection (see Fig. 1). Standard deviations are derived from measurements with three technical replicates. B: Immunoblot analysis of LHCSR3 accumulation in WT and stm6glc4 during H2 production. Protein extracts were derived from the samples taken during microarray sample collection and the indicated time points correspond to those shown in Figure 1. Along with the immunodetection of LHCSR3 (αLHCSR3) a Coomassie-stained gel is shown to assess protein loading. C: Immunodetection of the major light-harvesting protein isoforms 4 and 6 (αLHCBM4/6) in protein extracts from WT and stm6glc4. Samples for protein extraction were taken along with the sample collection for RNA extraction prior to microarray analysis. The indicated time points are identical to the time points used for the microarray studies.

