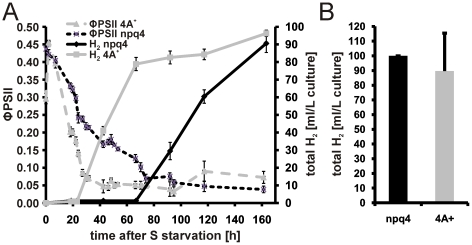
Figure 6. Comparison of np4 and the WT strain 4A+ regarding their H2 production capacity and quantum yield kinetics after sulphur depletion.
A: Representative H2 measurement with np4 and 4A+. Changes in the photosynthetic quantum yield (ΦPSII) were recorded and plotted on the left y-axis. The total amount of H2 produced (total H2 [ml/L culture]) during the experiment is indicated on the right y-axis and the duration of the measurement (time after S starvation) is given on the x-axis. Black lines represent the mutant np4 and grey lines the WT 4A+ (continuous line H2 yield; dotted line ΦPSII). Standard deviations derived from three technical replicates are indicated as error bars. B: Total H2 yields from np4 (black bar) and 4A+ (grey bar) are given as mean values calculated from three independent biological replicates using three technical replicates per measurement. Error bars indicate standard deviations.

