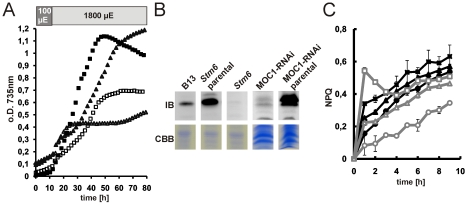
Figure 7. LHCSR3 expression and non-photochemical quenching capacity in stm6, B13, MOC1-RNAi and parental WT strains.
A: Phototrophic high light growth (1800 µE) of Stm6 (open triangles), B13 (filled triangles), MOC1-RNAi (open squares) and its parental strain cc124 (filled squares) in minimal media (HSM). The light regime (15 h 100 µE; 65 h 1800 µE) is indicated with light or dark grey shaded boxes at the top of the panel. Shown is one representative growth out of three independent growth experiments. B: Immunoblot analysis (αLHCSR3) of LHCSR3 protein expression in phototrophically grown stm6, B13, stm6 parental (cc1618), MOC1-RNAi and MOC1-RNAi parental (cc124) cells. Cells were first cultivated in 100 µE for 15 h before the light intensity was increased to 1800 µE. Samples for protein extraction were taken after eight hours of high-light treatment. Protein loading is shown with a Coomassie stain (CBB). C: Determination of the non-photochemical quenching (NPQ) capacity in stm6 (circles), B13 (triangles) and stm6 parental (squares). Cultures were either incubated in low light (filled symbols; black lines) or high light (open symbols; grey lines) prior to the measurement of NPQ over 10 min.

