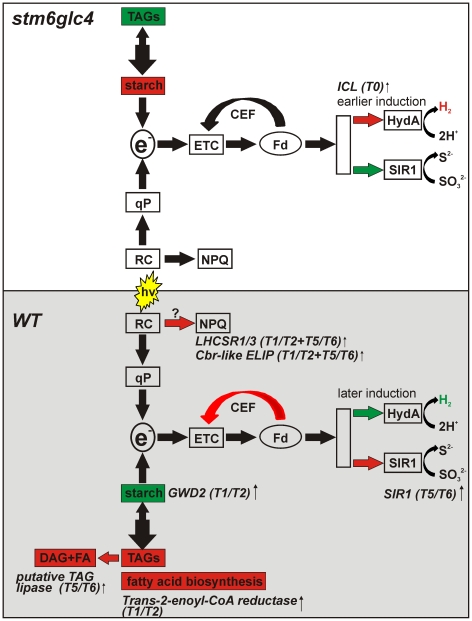
Figure 10. Summary of the transcriptomic differences between WT (grey shaded box) and mutant stm6glc4 (white box) which contribute to an increased H2 production capacity of the mutant.
A relative increase in the size of metabolite pools is indicated by a red and a decrease by a green colour. The metabolomic data used in the model were taken from Doebbe et al. [11]. The upregulation of physiological processes or pathways is also indicated by red and a downregulation by a green colour. The names of differentially expressed genes (see Table 1 and 2) are given along with the time points for which a WT- or mutant-specific regulation was identified. Abbreviations/symbols: TAGs (triacylglycerides); e− (electrons fed into the H2ase pathway); ETC (electron transport chain); CEF (cyclic electron flow around PSI); Fd (ferredoxin); HydA (H2ase isoform A); SIR1 (ferredoxin-dependent sulfite reductase); qP (photochemical quenching); RC (reaction center of PSII); NPQ (non-photochemical quenching); DAG (diacylglycerol); FA (fatty acid).

