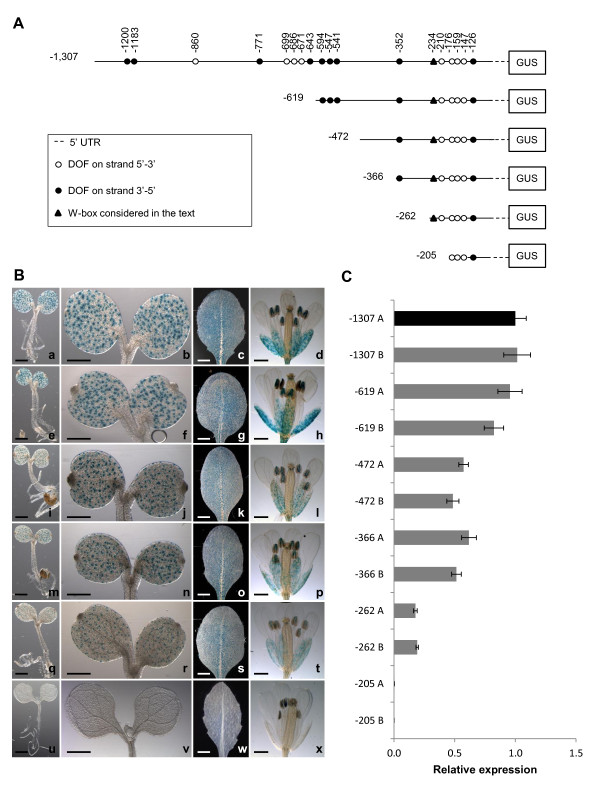
Figure 2.
Deletion analysis of the AtMYB60 upstream region. A, Schematic diagrams of different deletions of AtMYB60 upstream region fused to the GUS reporter gene. The positions of the different DOF-binding sites and of the W-box, described in the text, are shown. B, Histochemical assay for GUS activity in seedlings, rosette leaves and flowers of plants transformed with -1,307::GUS (a-d), -619::GUS (e-h), -472::GUS (i-l), -366::GUS (m-p), -262::GUS (q-t) and -205::GUS (u-x) constructs. The analysis of independent lines harbouring the same construct showed identical patterns of GUS staining. Samples were incubated in the staining solution for 16 hours for all the lines, with the exception of line -205::GUS, for which the staining was prolonged to 48 hours. Scale bars represent 1 mm. C, Relative expression level of the GUS reporter gene in the different transgenic lines harbouring the -1,307::GUS (-1,307 A and B), -619::GUS (-619 A and B), -472::GUS, -366::GUS (-366 A and B), -262::GUS (-262 A and B) or -205::GUS (-205 A and B) constructs. Two lines for each construct were analysed by Real Time RT-PCR. The transcript amount in the line -1,307 A was arbitrarily set to 1 (black column) and used to normalize the relative expression levels in each line. The ACTIN2 gene (At3g18780) was used as a control.

