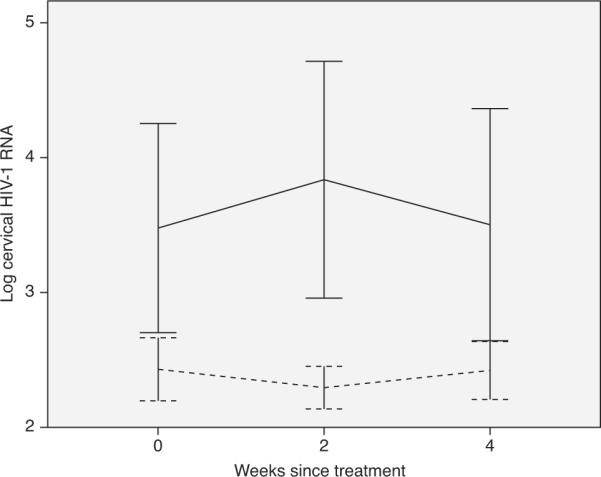
Fig. 1. Mean and 95% confidence interval of log10 cervical HIV-1 RNA viral load by weeks since cryotherapy.

Vertical lines are 95% confidence intervals (CIs) and horizontal lines are interpolation lines between the mean values. Dashed line = on antiretroviral therapy (ART); solid line = off ART.
