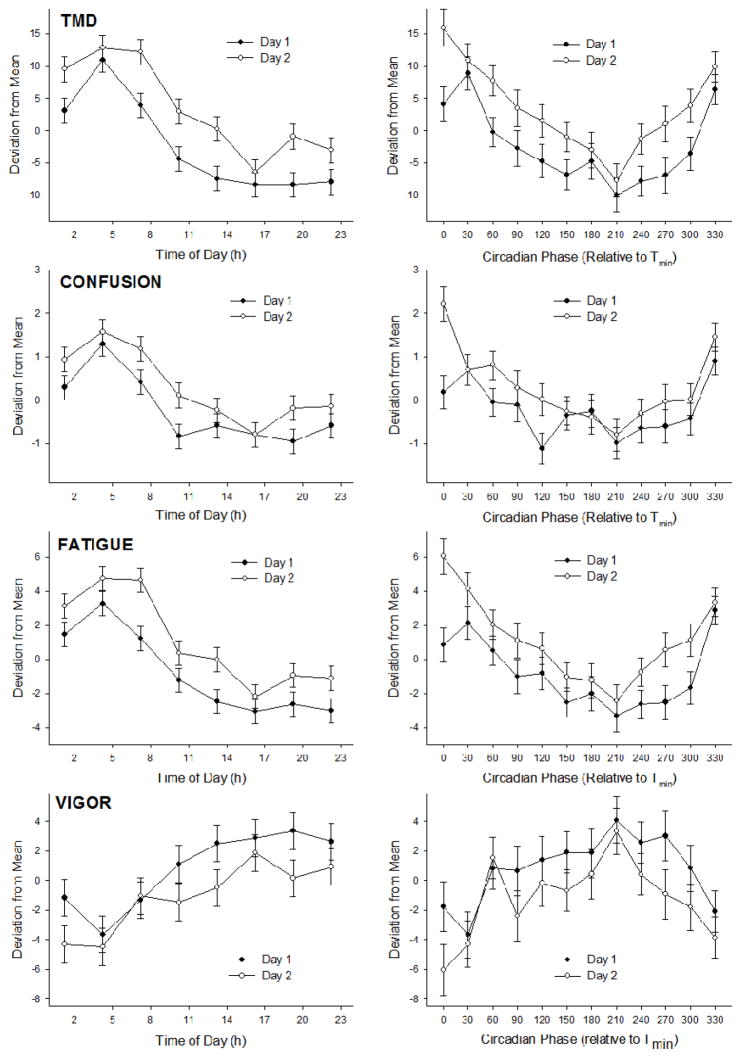
Figure 4. Selected POMS mood variables plotted relative to time of day and circadian phase.
Data are presented as mean ± SE and separated by day. The four POMS subscales with the most robust worsening of mood on day 2 of the protocol are shown. See Table 2 for statistical test results.

