. Author manuscript; available in PMC: 2013 Jan 1.
Published in final edited form as: Am J Med Sci. 2012 Jan;343(1):2–9. doi: 10.1097/MAJ.0b013e31823ea228

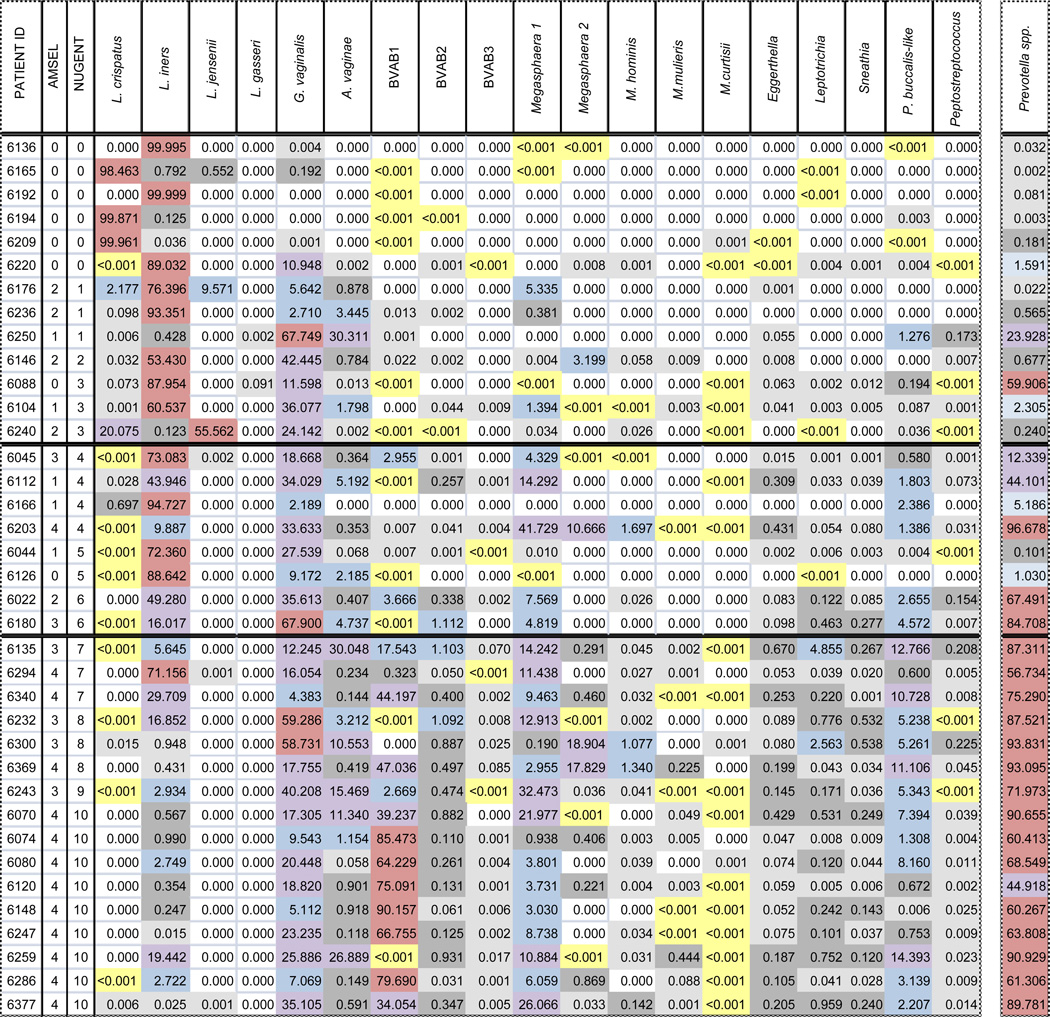
Table 1. Relative bacterial species composition (%) based on DNA extracted from vaginal specimens clinically diagnosed as normal (Nuget score of 0 to 3), intermediate (4 to 6), or BV (7 to 10).

The data shows the composition of the samples solely based on the 19 bacterial species assayed. The concentrations from each individual species-specific qPCR assay in each specimen were summed and each individual species concentration was expressed as a percentage of the total as follows:
  • graphic file with name nihms340652ig1.jpg 0%; graphic file with name nihms340652ig2.jpg <0.001%; graphic file with name nihms340652ig3.jpg 0.001 to <0.1%; graphic file with name nihms340652ig4.jpg 0.1 to <1%; graphic file with name nihms340652ig5.jpg 1 to <10%; graphic file with name nihms340652ig6.jpg 10 to <50%; graphic file with name nihms340652ig7.jpg 50 to 100%
The column labeled “Prevotella spp.” shows the percent contribution of this genus to the total composition of each specimen. The percent contribution was calculated as above, but in this case the concentrations of the total Prevotella spp. qPCR assay were included in the calculations instead of those of the P. buccalis-like qPCR. (This table is reproduced with permission from Zozaya-Hinchliffe M, Lillis R, Martin DH, Ferris MJ. Quantitative PCR assessments of bacterial species in women with and without bacterial vaginosis. J Clin Microbiol. 2010;48:1812-9.)
graphic file with name nihms340652t1.jpg