
Fig. 5.
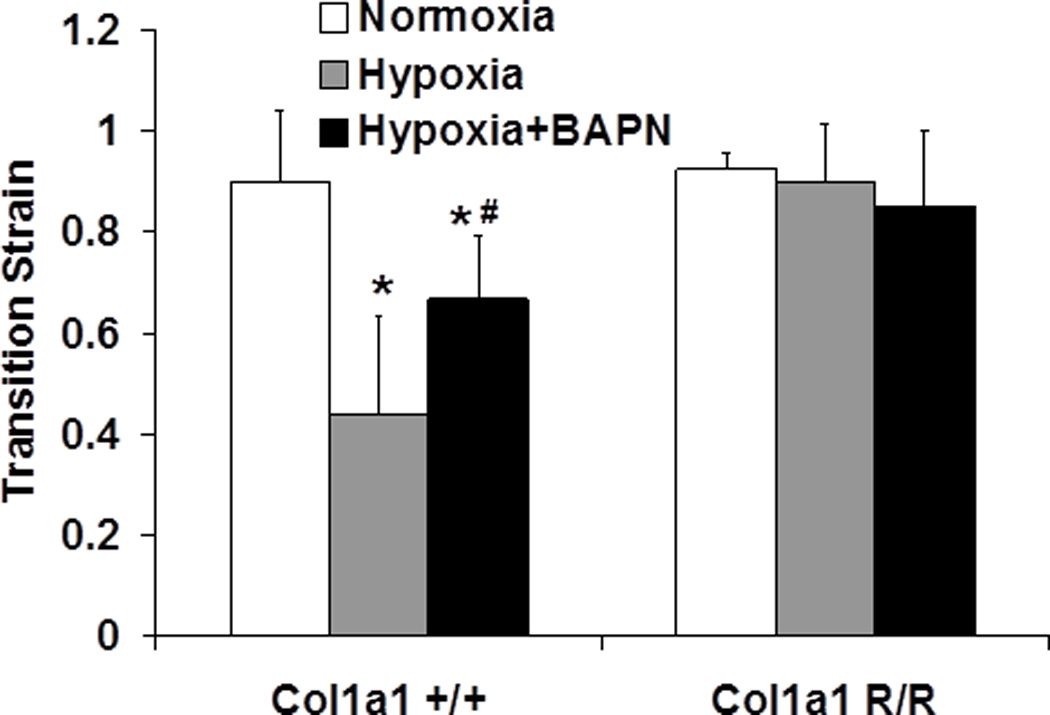
Transition strain measured from stress-strain curves in normoxia, hypoxia, and hypoxia + BAPN treatment groups (N = 5–7 per group, p < 0.05 for * hypoxia or hypoxia+BAPN vs. normoxia, and # hypoxia+BAPN vs. hypoxia).
Official websites use .gov
A
.gov website belongs to an official
government organization in the United States.
Secure .gov websites use HTTPS
A lock (
) or https:// means you've safely
connected to the .gov website. Share sensitive
information only on official, secure websites.
Transition strain measured from stress-strain curves in normoxia, hypoxia, and hypoxia + BAPN treatment groups (N = 5–7 per group, p < 0.05 for * hypoxia or hypoxia+BAPN vs. normoxia, and # hypoxia+BAPN vs. hypoxia).