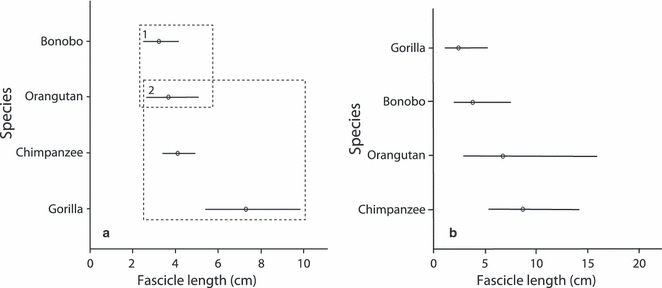
Fig. 3.

Results from Tukey's post-hoc tests displaying mean values and 95% confidence intervals for the different species for (a) pronator fascicle length and (b) wrist extensor fascicle length. Values presented are back-transformed from logged data. Dashed boxes represent the significantly different sub-sets as highlighted from Tukey's post-hoc tests; if there are no dashed boxes, Tukey's post-hoc tests did not reveal a significant difference between a specific pair.
