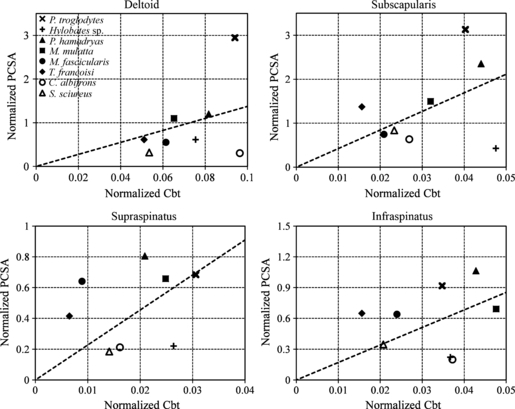
Fig. 9.

Diagram of the interrelationship between the normalized Cbt and normalized PCSA of the deltoid, subscapularis, supraspinatus, and infraspinatus. X-mark, the chimpanzee; cross, gibbon; solid triangle, baboon; solid square, rhesus macaque; solid circle, crab-eating macaque; solid diamond, lutong; circle, capuchin monkey; triangle, squirrel monkey. The dotted lines show the least-square regression through the coordinate origin.
