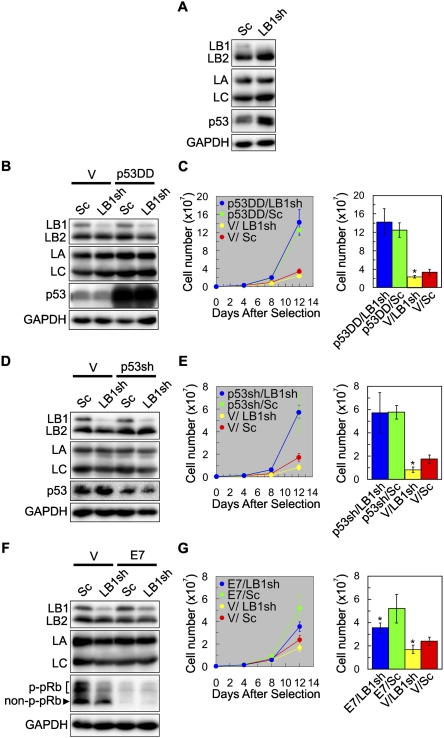
Figure 4.
p53, but not pRb, is required for the inhibition of cell proliferation by LB1 silencing. (A) WI-38 cells (PD24) were transfected with either the LB1sh or Sc vector. Six days after selection, the expression levels of LB1, LB2, LA/C, and p53 were determined by immunoblotting. (B–G) The requirements of the p53 and pRb pathways for the LB1 silencing effects on cell proliferation were examined. (B) Cells were transfected with either a p53 deletion mutant (p53DD) or a control vector (V), and then transfected with either LB1sh or Sc. (C) The graph shows that expression of p53DD resulted in increased proliferation and that there was no significant difference between p53DD/Sc (green) and p53DD/LB1sh (blue) (n = 3; P = 3.2 × 10⁻¹), but there was a change in proliferation between cells expressing V/Sc (red) and V/LB1sh (yellow) (n = 3; [*] P = 8.0 × 10⁻³). (D) Cells were transfected with either a p53 shRNA vector (p53sh) or a control vector (V) and then transfected with either LB1sh or Sc. (E) The graph shows that proliferation increased in cells with less p53 expression and that there was no significant difference in proliferation between p53sh/LB1sh (blue) and p53sh/Sc (green) (n = 3; P = 9.7 × 10⁻¹), but there was a significant difference between V/LB1sh (yellow) and V/Sc (red) (n = 3; [*] P = 5.7 × 10⁻⁴). The error bars for p53sh/LB1sh and p53sh/Sc overlap. (F) Cells were transfected with either a HPV E7 vector or a control vector (V) and then transfected with either LB1sh or Sc. Nonphosphorylated and phosphorylated pRb are indicated as non-p-pRb and p-pRb, respectively. (G) The graph shows that the proliferation of V/LB1sh (yellow) decreased compared with V/Sc (red) controls (n = 3; [*] P = 7.9 × 10⁻³). The rates of cell proliferation increased in E7/LB1sh and E7/Sc cells compared with V/LB1sh and V/Sc cells; there were even greater increases in the E7/Sc (green) compared with E7/LB1sh (blue) (n = 3; [*] P = 1.6 × 10⁻²). For clarity, the data from day 12 following selection are also displayed as histograms in C, E, and G. No significant changes in LB2 and LA/C protein levels were detected in any of the cells examined. GAPDH was used as a loading control. Error bars in graphs represent standard deviations. The bars with an asterisk mark experiments with significant changes ([*] P < 5.0 × 10⁻²).

