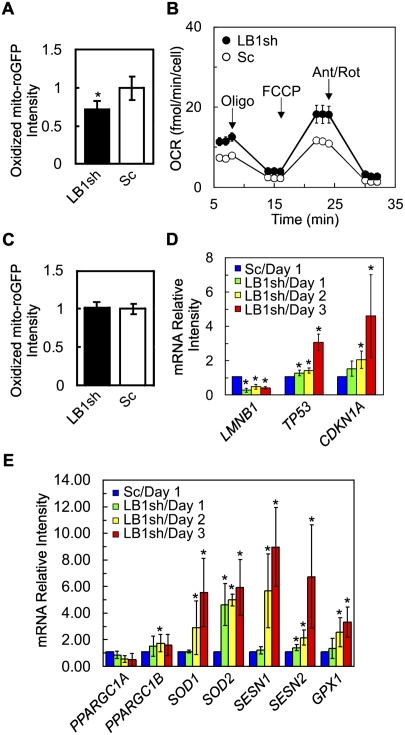
Figure 5.
The effects of LB1 silencing on mitochondrial ROS. Expression of roGFP was examined in WI-38 cells 3 d after selection for cells expressing either LB1sh or Sc. (A) Flow cytometric analysis indicates that LB1sh reduces the amount of oxidized roGFP. The black and white bars indicate the normalized mean oxidation of roGFP in LB1sh and Sc cells, respectively (n = 6, [*] P = 1.6 × 10⁻²). (B) OCR was measured in LB1sh and Sc cells incubated in basal medium and subsequently exposed to oligomycin (oligo) for ATP inhibition, carbonyl cyanide p-trifluoromethoxy-phenylhydrazone (FCCP) for mitochondrial uncoupling, and antimycin A/rotenone (Ant/Rot) for inhibiting electron transfer in complex I and complex III (see the Materials and Methods). There was a significant difference between LB1sh and Sc cells ([*] P = 5.6 × 10⁻⁴, 3.4 × 10⁻⁵, 6.6 × 10⁻⁶ and 2.2 × 10⁻³), respectively. The bars represent the standard errors of the mean. (C) Expression of p53DD inhibits the decrease in roGFP in LB1sh cells. There was no significant difference in the amount of oxidized roGFP between LB1sh and Sc (n = 6; P = 6.5 × 10⁻¹). (D) The levels of transcripts (mRNAs) of the LB1 gene (LMNB1), the p53 gene (TP53), and the p21 gene (CDKN1A) were determined in LB1sh and Sc cells by qPCR every 24 h for 3 d after selection (n = 4; [*] P < 5.0 × 10⁻² between Sc and LB1sh at days 1, 2, and 3). (E) The levels of transcripts (mRNAs) of the SOD1 (SOD1), SOD2 (SOD2), sestrin 1 (SESN1), sestrin 2 (SESN2), GPX1 (GPX1), PGC-1α (PPARGC1A), and PGC-1β (PPARGC1B) genes in LB1sh and Sc cells were determined by qPCR every 24 h for 3 d after selection (n = 4; [*] P < 5.0 × 10⁻² between Sc and LB1sh at days 1, 2, and 3). The error bars in A, C, D, and E represent standard deviations. The bars with an asterisk mark experiments with significant changes ([*] P < 5.0 × 10⁻²).

