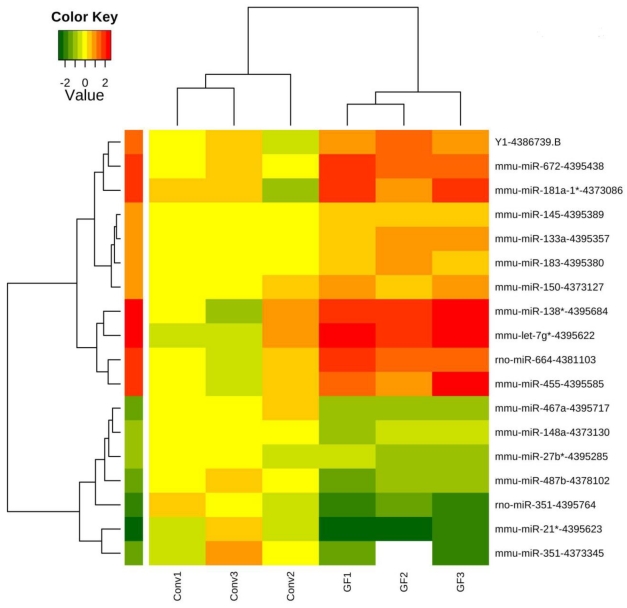
Figure 2.
Clustering of caecal microRNAs expression profiles in germ-free and conventionally raised mice. The profiles of 18 transcripts including 16 microRNAs significantly differently expressed (p<0.05, FDR<20%) between germ-free and conventional caecal samples were visualized using a supervised heatmap (complete linkage and Euclidean distance metric). Expression values range from +2.5 log2 to -2.5 log2 of ∆Ct values normalized using mean expression value normalization with positive values (red) indicating higher expression and negative values (green) indicating lower expression in germ-free versus conventional mice. Dendrograms indicate the correlation between groups of samples and genes. Samples are in columns and transcripts in rows.

