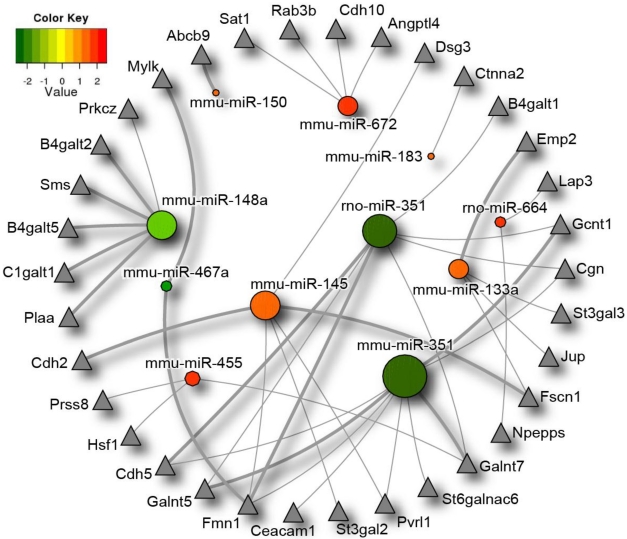
Figure 3.
Differentially expressed microRNAs impact on the intestinal barrier. MicroRNAs significantly differentially expressed between germ-free and conventional mice are represented in this diagram by circles, with the colour corresponding to degree of differential microRNA expression in germ-free and conventional samples. Expression values range from +2.5 log2 to -2.5 log2 of ∆Ct values with positive values (red) indicating higher expression, and negative values (green), indicating lower expression in germ-free versus conventional mice. Putative intestinal barrier gene targets as identified by the algorithms TargetScan and PITA are represented by triangles. MicroRNAs with a greater number of intestinal barrier targets are symbolized with a larger circle size. Intestinal barrier gene targets that are predicted by both algorithms are indicated by thicker lines. Differentially expressed microRNAs* were not included in the diagram as they are not present in both prediction databases. miR-487b did not have any intestinal barrier targets as per the algorithms and therefore was excluded from the figure.

