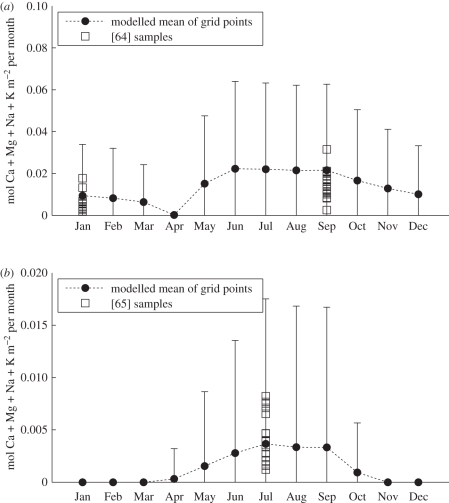
Figure 4.
Model runs compared with data for individual watersheds. The model outputs are corrected for erosion and runoff. The mean (solid black circles) and standard deviation (error bars) of the modelled cationic fluxes from silicate weathering for grid points within the watersheds are shown for comparison with the observational data (squares). (a) Hong river. Original observational data from near the mouth of the river [64] show seasonal differences in fluxes that our model captures. (b) Amur river. Silicate weathering rates, calculated using mean annual runoff [65], were divided by 12 to give monthly average values. The lowest four points are from sample sites on the main Amur channel.

