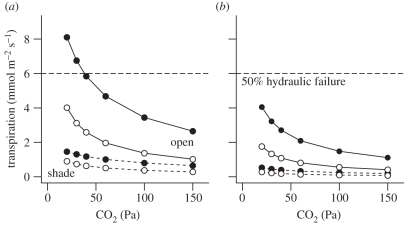
Figure 6.
Modelled response of transpiration to CO2 for C3 and C4 leaves in open (solid lines) and shaded rainforest understorey (dashed lines) conditions in either (a) humid tropical or (b) humid temperate climates. The model is described in appendix A. Horizontal dashed lines indicate the transpiration rate that would cause 50% hydraulic failure in the absence of feedbacks on stomatal conductance. Filled circles, C3; open circles, C4.

