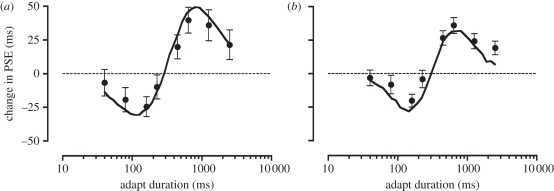
Figure 6.
Comparison of experimental and model data. Data points show mean shifts in the PSE as a function of adaptor duration (re-plotted from figure 3). Solid lines show the predictions of the best-fitting model. (a) Visual: n = 20; σ = 0.25 (log units); Amax = 50%; Aσ = 0.45 (log units). (b) Auditory: n = 30; Aσ = 0.2 (log units); Amax = 50%; Aσ = 0.35 (log units).

