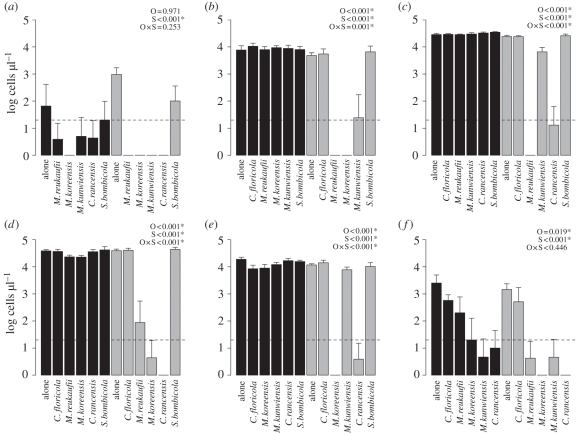
Figure 2.
Final cell density of the focal species, including (a) C. floricola; (b) C. rancensis; (c) M. koreensis; (d) M. kunwiensis; (e) M. reukaufii; and (f) S. bombicola when introduced with another species (indicated on x-axis). Bars show the logarithmic mean of five replicates ±1 s.e., measured on day 5. Dashed line shows the initial inoculation density. Black bars show final cell densities when the focal species was introduced on day 0, and grey bars when introduced on day 2. Results of two-way ANOVA are shown in the upper right. Introduction O, order; S, species identity; O × S, interaction between order and species main effects. Asterisks indicate statistical significance after sequential Bonferonni correction for multiple tests.

