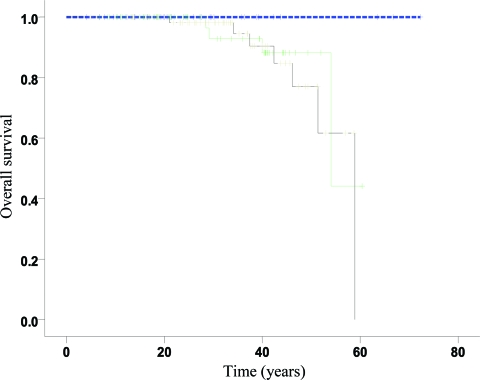
Figure 3.
Kaplan–Meier overall survival curves for group I (blue), group II (green), and group III (black) demonstrating excellent prognosis when enchondromas are restricted to the small bones of the hands and feet (group I). However, as soon as enchondromas are located in the long and flat bones, with or without disease in the small bones as well (group II and group III, respectively), the overall survival time is shorter. The difference between the curves is borderline significant (log-rank trend test, p = .08). Note that there are only zero, four, and seven events in the three groups, respectively, which explains the rather low power of the test. Point estimates (95% confidence intervals) at time = 40 years were: group II, 88% (75%–100%); group III, 85% (70%–100%).

