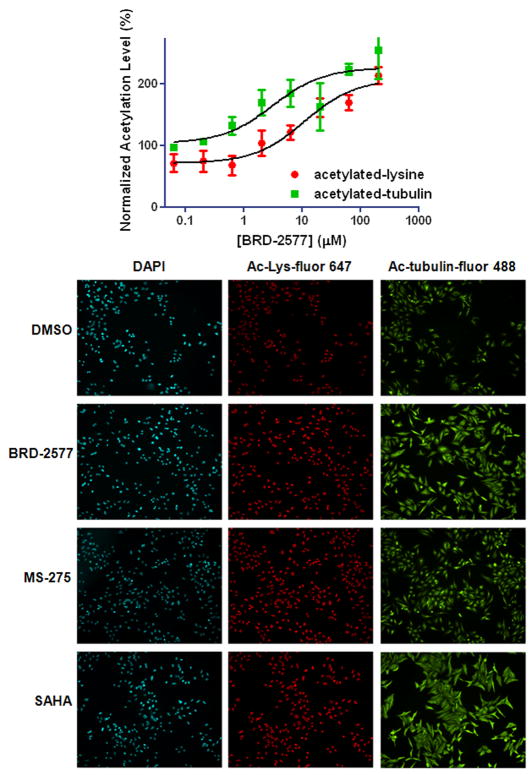
Figure 3.
Immunofluorescence microscopy of cells treated with BRD-2577. (A) Acetylated lysine and tubulin levels plotted against increasing concentration of BRD-2577. (B) Representative images of Hoechst (cyan), acetylated lysine (red), acetylated tubulin (green) for DMSO, BRD-2577 (6 μM), SAHA (0.6 μM), and MS-275 (0.6 μM).

