
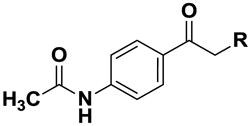
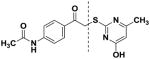
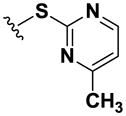
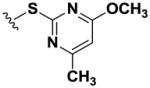
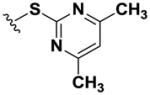
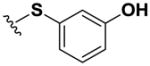
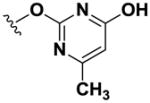
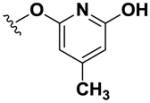
Table 1.
SAR on the pyrimidine ring and respective IC50 values.
 |
HDAC IC50 (μM)a | |||||||||
|---|---|---|---|---|---|---|---|---|---|---|
| Compound | R | 1 | 2 | 3 | 4 | 5 | 6 | 7 | 8 | 9 |
| 7 |
|
16.4 (±1.08) | 18.9 (±1.10) | 15.2 (±1.05) | 32.5 (±1.07) | 27.9 (±1.05) | 11.2 (±1.09) | 24.4 (±1.07) | 23.9 (±1.07) | 74.1 (±1.10) |
|
| ||||||||||
| 8 |
|
>100 | >100 | >100 | >100 | >100 | >100 | >100 | >100 | >100 |
| 9 |
|
>100 | >100 | >100 | >100 | >100 | >100 | >100 | >100 | >100 |
| 10 |
|
>100 | >100 | >100 | >100 | >100 | >100 | >100 | >100 | >100 |
| 11 |
|
>100 | >100 | >100 | >100 | >100 | >100 | >100 | >100 | >100 |
| 12 |
|
>100 | >100 | >100 | 54.2 | 16.7 | 88.0 | 31.9 | >100 | 11.7 |
| 13 |
|
>100 | >100 | >100 | >100 | >100 | >100 | >100 | >100 | >100 |
a
Values are means of >2 experiments