
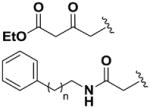
Table 2.
SAR on the phenyl moiety and respective IC50 values.
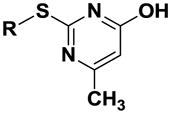 |
HDAC IC50 (μM)a | |||||||||
|---|---|---|---|---|---|---|---|---|---|---|
| Compound | R | 1 | 2 | 3 | 4 | 5 | 6 | 7 | 8 | 9 |
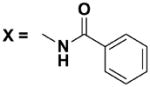
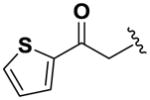
| 14 |
|
>100 | >100 | >100 | >100 | >100 | >100 | >100 | >100 | >100 |
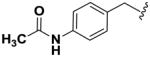
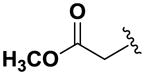
| 15 |
|
>100 | >100 | >100 | >100 | >100 | >100 | >100 | >100 | >100 |
| 16 | X = H | >100 | >100 | >100 | >100 | >100 | 13.7 | >100 | >100 | >100 |
| 17 |
|
>100 | >100 | >100 | >100 | >100 | >100 | >100 | >100 | >100 |
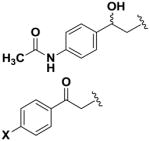
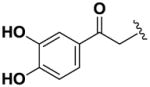
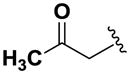
| 18 |
|
>100 | >100 | >100 | >100 | >100 | 10.8 | >100 | >100 | >100 |
| 19 | X = OCH3 | >100 | >100 | >100 | >100 | >100 | 60.9 | >100 | >100 | >100 |
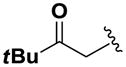
| 20 | X = tBu | >100 | >100 | >100 | >100 | 94.3 | >100 | >100 | >100 | >100 |
| 21 | X = Cl | 82.3 | 67.0 | 86.4 | >100 | >100 | 12.9 | >100 | >100 | >100 |
| 22 | X = OH | >100 | >100 | >100 | >100 | >100 | 40.1 | >100 | >100 | >100 |
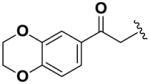
| 23 |
|
>100 | >100 | >100 | >100 | >100 | 16.7 | >100 | >100 | >100 |
| 24 |
|
>100 | >100 | >100 | >100 | >100 | >100 | >100 | >100 | >100 |
| 25 |
|
>100 | >100 | >100 | >100 | >100 | 32.6 | >100 | >100 | >100 |
| 26 |
|
>100 | >100 | >100 | >100 | >100 | 24.8 | >100 | >100 | >100 |
| 27 |
|
>100 | >100 | >100 | >100 | >100 | >100 | >100 | >100 | >100 |
| 28 |
|
>100 | >100 | >100 | >100 | >100 | >100 | >100 | >100 | >100 |
| 29 |
|
>100 | >100 | >100 | >100 | >100 | >100 | >100 | >100 | >100 |
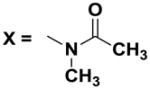
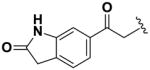
| 30 |
|
77.2 | 69.3 | 40.0 | >100 | 48.6 | 7.2 | >100 | >100 | >100 |
| 31 | n = 3 | >100 | >100 | >100 | >100 | >100 | >100 | >100 | >100 | >100 |
| 32 | n = 1 | >100 | >100 | >100 | >100 | >100 | >100 | >100 | >100 | >100 |
| 33 | n = 5 | >100 | >100 | >100 | >100 | >100 | >100 | >100 | >100 | >100 |
a
Values are means of >2 experiments