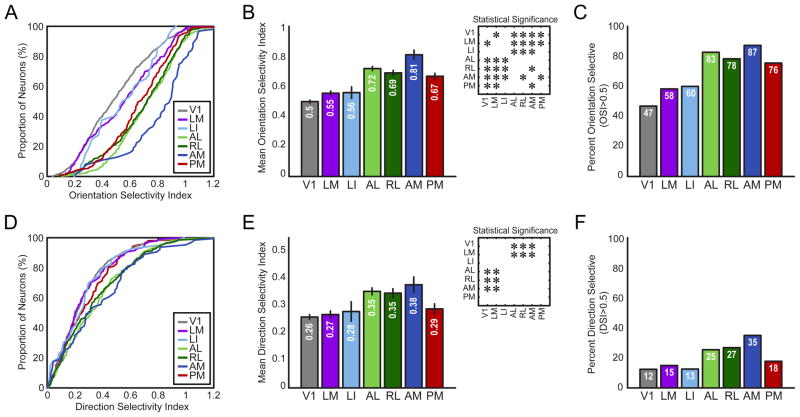
Figure 6. Encoding for orientation and direction information differs across visual areas.
(A) Cumulative distributions of orientation selectivity index (OSI) for each area. (B) Mean OSI for each visual area. (C) Percent of highly orientation selective neurons (OSI > 0.5) across the population for each area. (D) Cumulative distributions of direction selectivity index (DSI) for the population of neurons in each visual area. (E) Mean DSI for each visual area. (F) Percent of highly direction selective neurons (DSI > 0.5) across the population for each visual area. Insets in (B) and (E) show statistical significance (p < 0.05) of pair-wise comparisons between areas, corrected for multiple comparisons using the Tukey-Kramer method. Error bars are standard error of the mean (S.E.M.) in (B, D).

