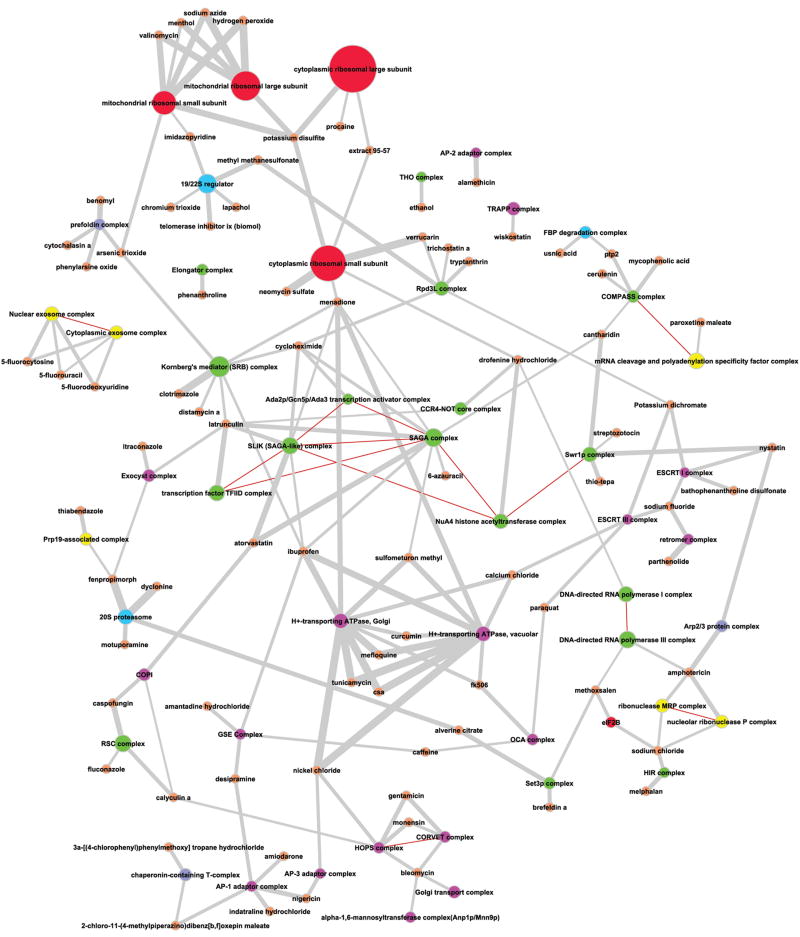
Figure 1. Network of chemical compounds and protein complexes.
High-Confidence interactions (Fisher Exact Test; p ≤ 10-4) between proteins and chemical compounds were obtained through the integration of chemical-genetic, protein-protein interaction and protein complex data. Although the CPCnet is a directed graph, the arrowheads are not shown, since the directionality is not considered in this analysis. Edges connecting chemicals and protein complexes (gray) were weighted according to the negative log10(p) of each interaction. Red edges connect complexes which compositions have at least one protein in common and are all unweighted. The sizes of nodes representing protein complexes are proportional to the number of unique proteins in the complex, whereas all chemical nodes have fixed and equal sizes. Color codes: Orange: chemical compounds; Green: chromatin-related complexes; Pink: Golgi/vacuolar/vesicular complexes; Yellow: RNA processing apparatus; Red: Translation machinery; Blue: proteasome; Purple: cytoskeleton-related complexes. The subgraph mentioned in the text interlinking several vesicular dynamics complexes is at the bottom of the figure.

