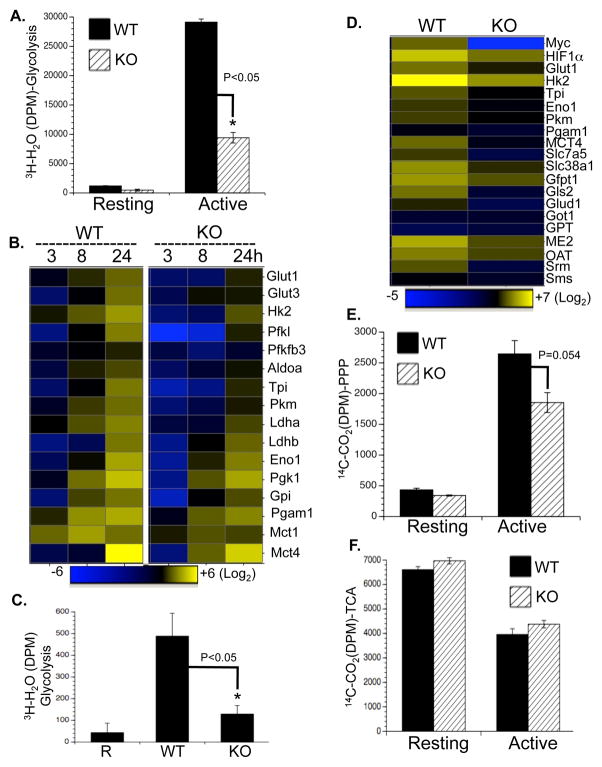
Figure 5. Myc drives a transcription program that regulates glucose catabolism upon T cell activation.
(A) Glycolytic flux as determined by the generation of 3H2O from [3-3H]-glucose.
(B) qPCR analyses of metabolic genes. mRNA levels in resting WT T cells were set to 1. The heat map represents the log2 value of the relative mRNA expression level (see color scale). Values and standard deviations are provided in Table S5. Data are representative of two independent experiments, performed in triplicate.
(C–D) Naïve CD4+Vβ8+ T cells (R) were sorted from mice without SEB immunization; WT and acutely Myc-deleted CD4+Vβ8+ T cells (KO) were isolated from mice two days after SEB immunization (Fig. 4F). Glycolysis (C) and mRNA expression (D and Table S5) in the indicated groups were determined by the generation of 3H2O from [3-3H]-glucose and qPCR.
(E–F) PPP flux (E) and pyruvate oxidation through the TCA cycle (F) were determined by the generation of 14CO2 from [1-14C]-glucose and from [2-14C]-pyruvate, respectively.

