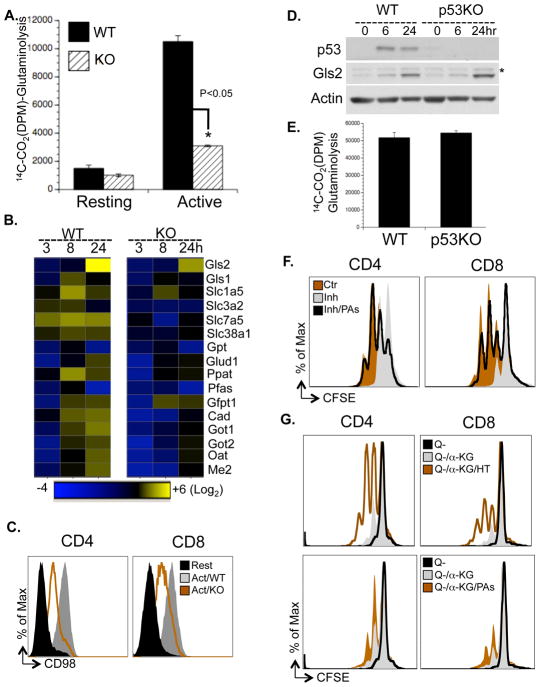
Figure 6. Myc drives a transcriptional program coupling glutaminolysis to biosynthetic pathways.
(A) Rates of glutaminolysis, determined by the generation of 14CO2 from [U-14C]-glutamine. Data are representative of two independent experiments.
(B) qPCR analyses of metabolic genes. mRNA levels in resting WT T cells were set to 1. The heat map represents the log2 value of the relative mRNA expression level (see color scale). Values and standard deviations are provided in Table S5. Data are representative of two independent experiments.
(C) Cell surface expression of CD98 was determined by flow cytometry.
(D) Protein levels of Gls2 and p53 were determined by immunoblot. The asterisk indicates a non-specific band.
(E) Glutaminolytic flux was determined by the generation of 14CO2 from [U-14C]-glutamine.
(F) Cell proliferation of active T cells (48hr), treated with vehicle (Ctr), with 1mM DFMO (Inh) or with 1mM DFMO plus polyamine mixture (Inh/PAs), determined by CFSE dilution. The composition and concentration of polyamine mixture are provided in Table S7.
(G) T cells were collected at 72hr after activation in glutamine free media (Q−), in glutamine free media supplemented with 2μM α-KG (Q−/αKG), in glutamine free media supplemented with 2μM α-KG and 100μM hypoxanthine and 16μM thymidine (Q−/αKG/HT) or in glutamine free media supplemented with 2μM α-KG and polyamine mixture (Q−/αKG/PAs). The composition and concentration of the polyamine mixture is provided in Table S7. Cell proliferation was determined as CFSE dilution by flow cytometry.

