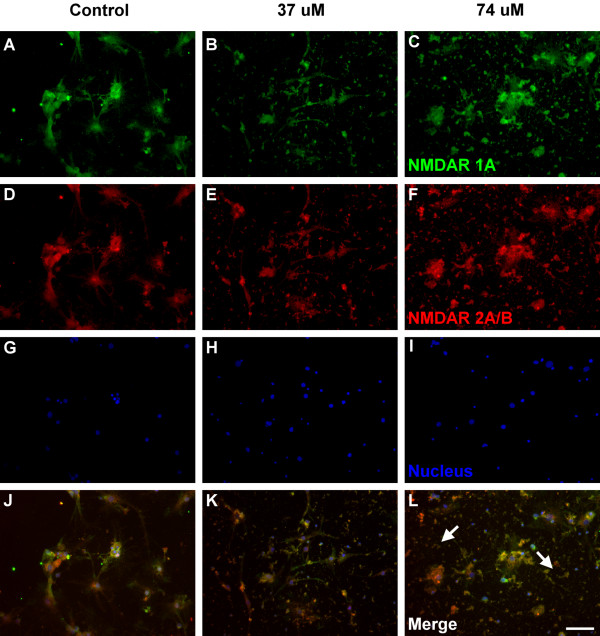
Figure 3.
Fluorescence immunocytochemical images of the cultured hippocampal neurons. Green (A, B, C), red (D, E, F) and blue (G, H, I) fluorescence represent NMDAR 1A, NMDAR 2A/B and the nucleus of the cells, respectively. (J), (K) and (L) are neurons cultured with 0, 37 and 74 μM Al for 14 days (PND 17). White arrows label the cell debris and white line shows the scale bar expressed as 50 μm.

