FIGURE 2:
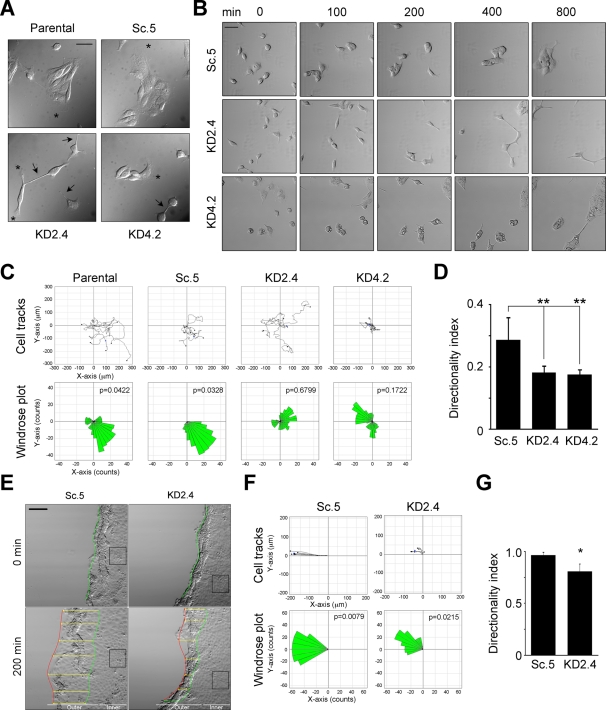
Knockdown of LMα5 results in loss of directional migration. (A) Parental MDCK (P), Sc.5, KD2.4, and KD4.2 cells were grown on collagen-coated coverslips in hormone-supplemented, serum-free ExCell medium for 6 h and photographed using DIC microscopy. Arrows indicate cell protrusions and asterisks indicate lamellipodia. Scale bar, 20 μm. (B) Time-lapse videomicroscopy of Sc.5, KD2.4, and KD4.2 cells. Still DIC frames (in minutes, after 1 h of adhesion) of a representative video of at least four independent experiments are shown. Scale bar, 50 μm. (C) Migration of parental (P), Sc.5, KD2.4, or KD4.2 individual cells was tracked and plotted (top) and analyzed for persistence of migration (bottom, windrose plots). The p values for circular dispersion were calculated using the Rayleigh test for vectorial data. (D) Mean values for the directionality index (±SD, n = 5) are shown as a bar graph. p = 0.004 (multicomparison analysis); **p < 0.01. (E) Time-lapse videomicroscopy still images of confluent Sc.5 or KD2.4 cell cultures after wounding. The beginning (0 min) and the end locations of the wound edge (200 min) are indicated by the green and red lines, respectively, whereas the overall progression of the wound edge is indicated by the yellow arrows. The black boxes correspond to “inner” cells analyzed separately in Supplemental Figure S1. Scale bar, 100 μm. (F) Cell tracks (top) and windrose plots (bottom) corresponding to either Sc.5 or KD2.4 cells at the wound edge. (G) The mean directionality index (±SD, n = 3) of cells at the wound edge is represented as a bar graph. p = 0.0286 (multicomparison analysis); *p < 0.05.

