FIGURE 5:
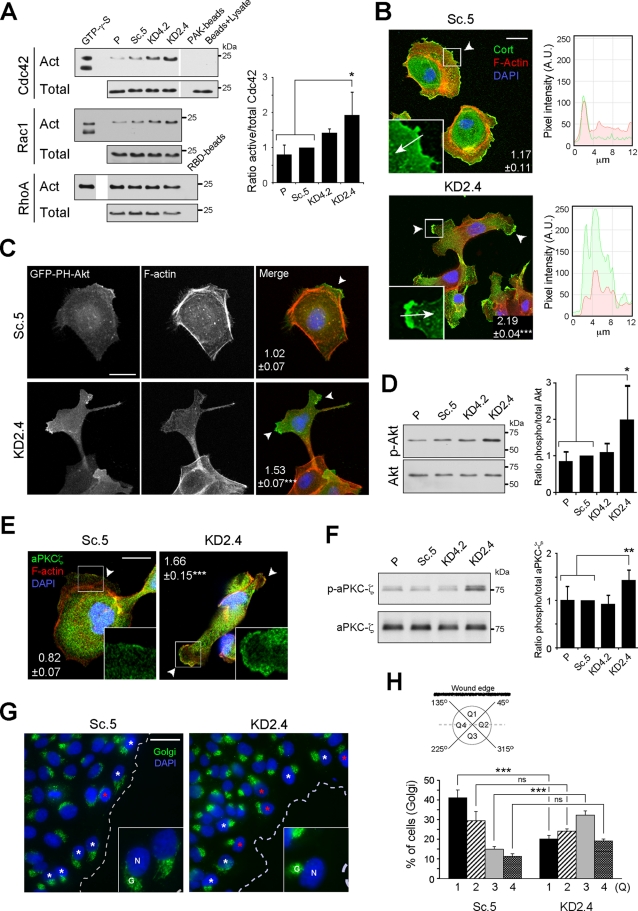
The polarization machinery is dysregulated in LMα5-suppressed cells. (A) Pull-down assays for active (Act) Cdc42, Rac1, and RhoA. A fraction of the lysates prior to pull-down was immunoblotted as total input. GTP-γ-S was a positive control for activation, whereas either PAK or RBD beads alone or only glutathione–agarose beads incubated with cell lysates (beads + lysate) were negative controls. The mean active/total ratio (±SD, n = 3) normalized to Sc.5 for Cdc42 is shown in the graph on the right. p = 0.0237 (multicomparison analysis); *p < 0.05. Differences in Rac1 and RhoA activities relative to controls were not significant, and quantitative data are not shown. (B) Confocal fluorescence micrographs of either Sc.5 or KD2.4 cells stained for cortactin (green), F-actin (red), and nuclei (blue). Arrowheads indicate lamellipodia/cell protrusions, and the mean number of positive protrusions (±SEM, n = 3) per cell is indicated. p < 0.0001 (multicomparison analysis); ***p < 0.001. Scale bar, 20 μm. Inset, detail of lamellipodium/cell protrusion showing only the green channel (cortactin); arrows indicate the direction of pixel intensity measurement for the histograms to the right, with red corresponding to actin staining. A.U., arbitrary units. (C) Confocal fluorescence micrographs of either Sc.5 or KD2.4 cells transiently transfected with GFP-PH-Akt (green) and stained for F-actin (red) and nuclei (blue). The mean number (±SEM, n = 2) of positive protrusions (arrowheads) per cell is indicated. p = 0.0055; **p < 0.01. Scale bar, 20 μm. (D) Immunoblot of phosphorylated and total Akt. The graph represents the mean ratio (±SD, n = 5) phospho/total Akt normalized to Sc.5. p = 0.0173 (multicomparison analysis); *p < 0.05. (E) Confocal fluorescence micrographs of either Sc.5 or KD2.4 cells stained for aPKCζ (green), F-actin (red), and nuclei (blue). The mean number (±SEM, n = 2) of positive protrusions (arrowheads) per cell is indicated. p < 0.0001; ***p < 0.001. Scale bar, 20 µm. Inset, detail of a lamellipodium/cell protrusion showing only the green channel (aPKCζ). (F) Immunoblot of phosphorylated and total aPKCζ. The graph represents the mean ratio (±SD, n = 6) phospho/total aPKCζ normalized to Sc.5. p = 0.0035 (multicomparison analysis); **p < 0.01. (G) Confocal fluorescence micrographs of either Sc.5 or KD2.4 cell monolayers wounded and stained 12 h later for Golgi (green) and nuclei (blue). White asterisks indicate examples of polarized Golgi complex orientation, and red asterisks indicate examples of Golgi oriented backward with respect the wound edge (dotted line). Scale bar, 20 μm. Inset, magnification of cells at the wound edge showing the nuclei (N) and Golgi (G). (H) Each cell at the wound edge was divided into four quadrants (Q1–Q4) centered on the nucleus (see scheme), and Golgi orientation was scored as percentage of cells with the Golgi complex in each quadrant (mean ± SEM, n = 3). p < 0.0001 (multicomparison analysis); ***p < 0.001; ns: not statistically significant.

