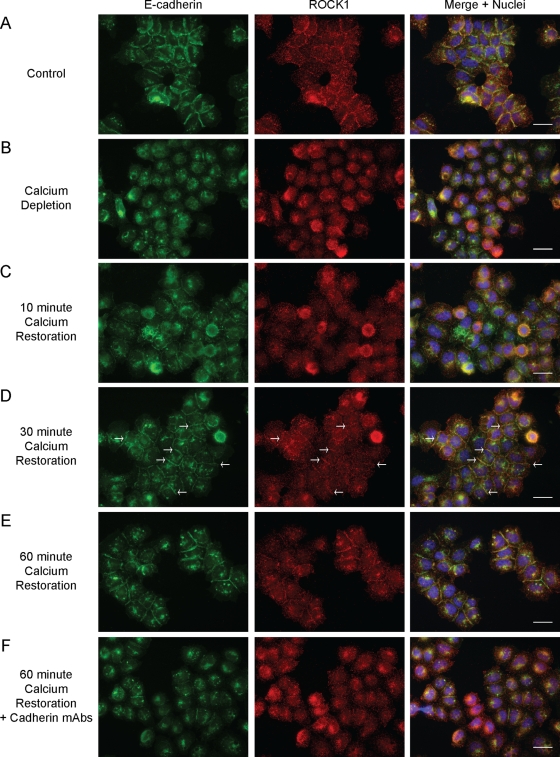
FIGURE 3:
ROCK1 is recruited to AJs. Immunofluorescence analysis of E-cadherin (green) and ROCK1 (red) in A431 cells during a calcium-switch assay. Cells were fixed and stained under the following conditions: (A) no calcium depletion (control), (B) depletion of calcium using LCM, (C) 10-min postcalcium restoration, (D) 30-min postcalcium restoration (arrows indicate low levels of ROCK1 at cell junctions), (E) 60-min postcalcium restoration, (F) 60-min postcalcium restoration with incubation with E-cadherin– and P-cadherin–blocking antibodies (HECD-1 and 6A9). Scale bars: 10 μm.

